
The Million Dollar Burrito 🌯
A store caught our attention on the Shopify Exchange when it was listed for $5,000 with a revenue of $176,904 over 2 months this year. So, what’s the catch?
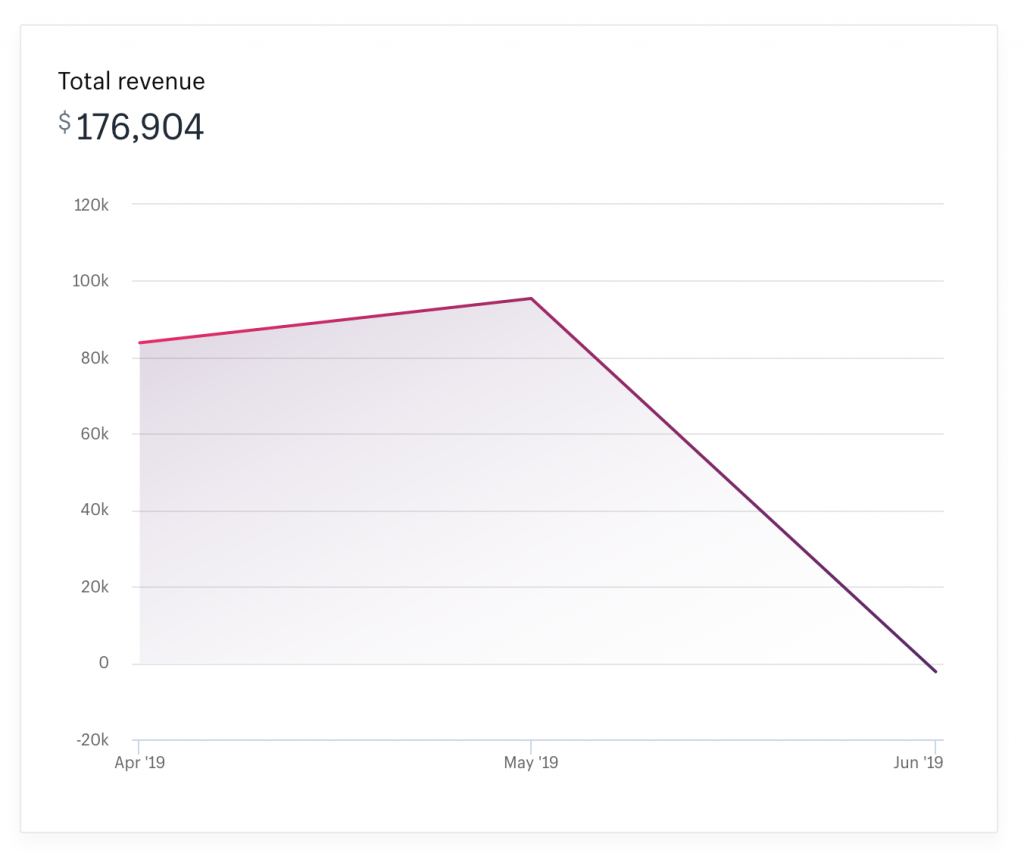
Let’s start some analysis to figure out what went wrong in June, as the Shopify Exchange listing where the store is being sold doesn’t address this. Browsing the store with the Trending Products toolbar enabled helps us verify that the store is real.
Store Research
Researching The Store’s Trends
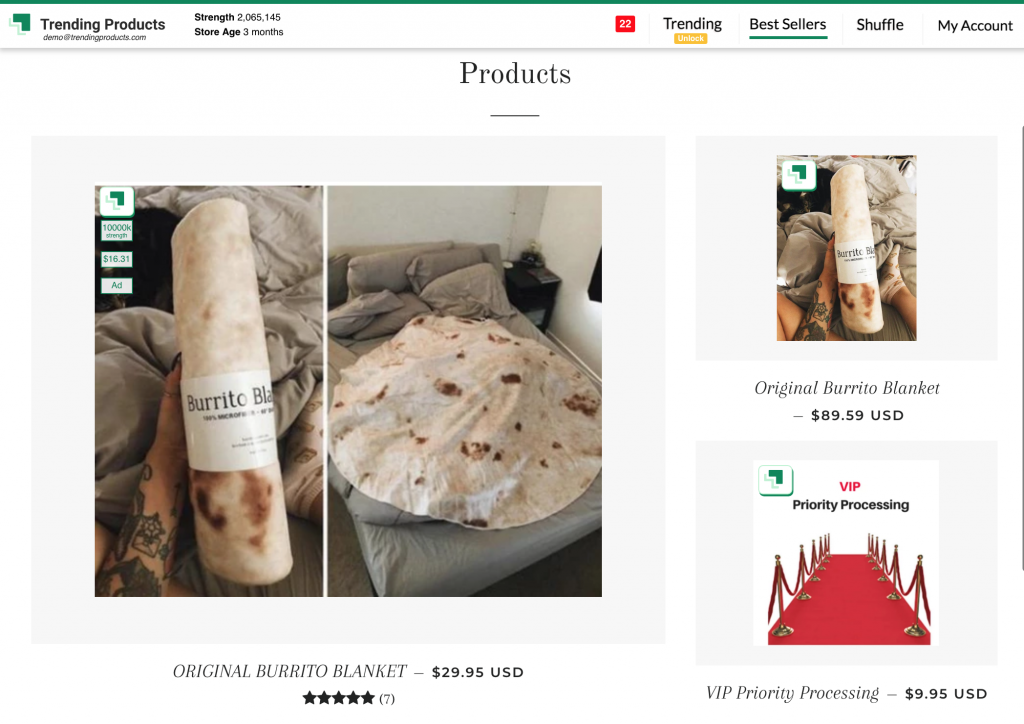
Looking at the screenshot above, we can see our toolbar added some data above the main product’s image. We can see from this at a glance that the product has a great strength metric, meaning trends have been detected. In addition, we can see that our toolbar has also found ads and a reliable supplier for the product.
Notice the store was detected by us 3 months ago in April, exactly when their main product first started to trend – this is when we would have sent it to users with us. It’s also further proof of how we do what we say we do and track every trend in real-time, as the data can be verified against the revenue stats that can’t be changed on a Shopify Exchange listing.
Supplier Detection
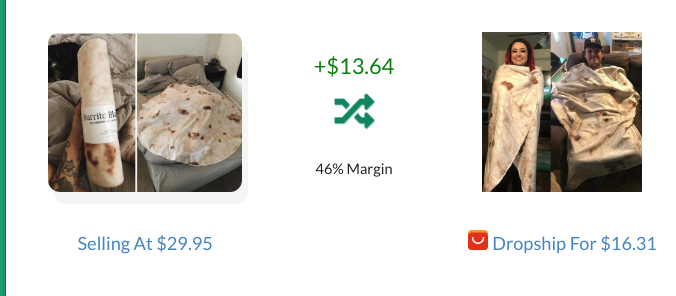
We Detected A Reliable Product Supplier
Product Ads
How Did It Sell? Easy! We Found The Product’s Ads!
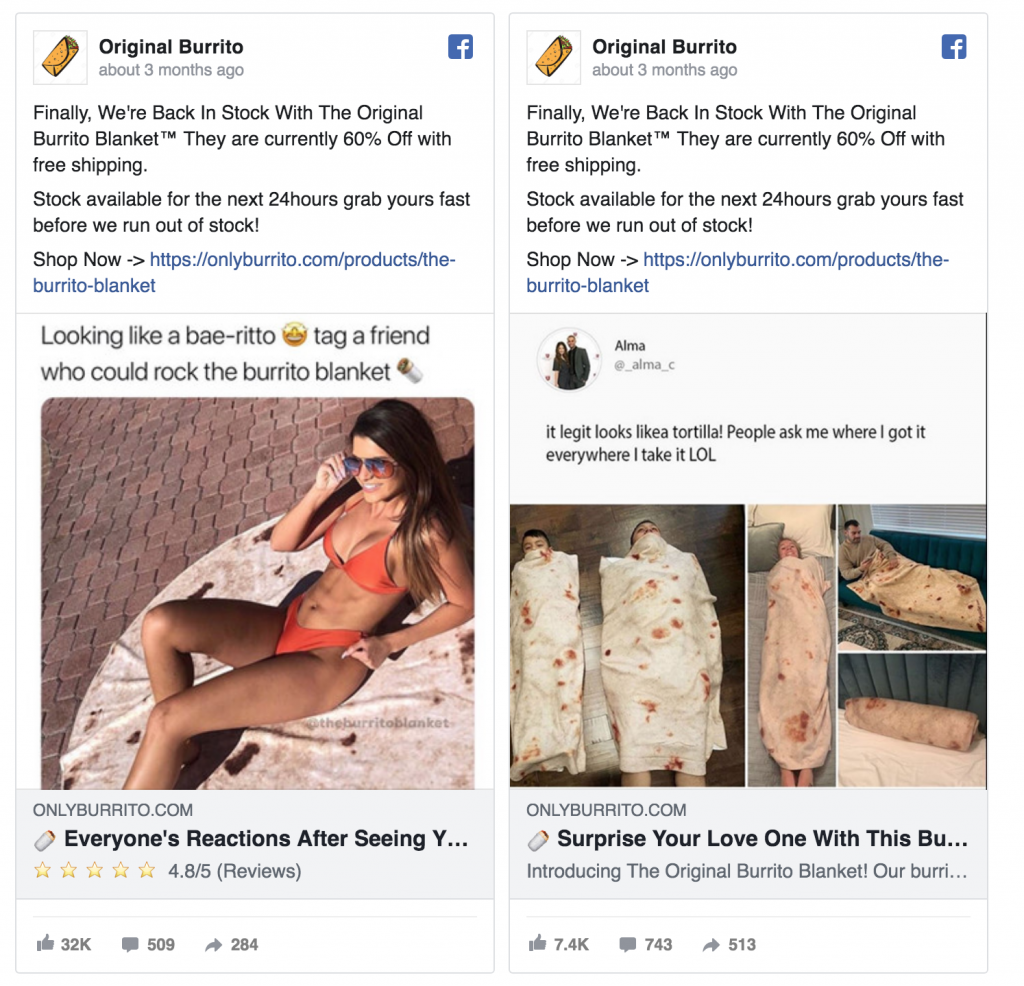
These are just two of the ads the store was using to promote the product, the store used a mix of static image ads and video ads. However, at this point we still don’t know why the store’s traffic dropped in June, so let’s look into that a little more.
One of the best ways to see how customers are responding to a product is by looking at recent comments on the ads detected by our toolbar.
Customer Feedback
Let’s Look At Some Customer Feedback
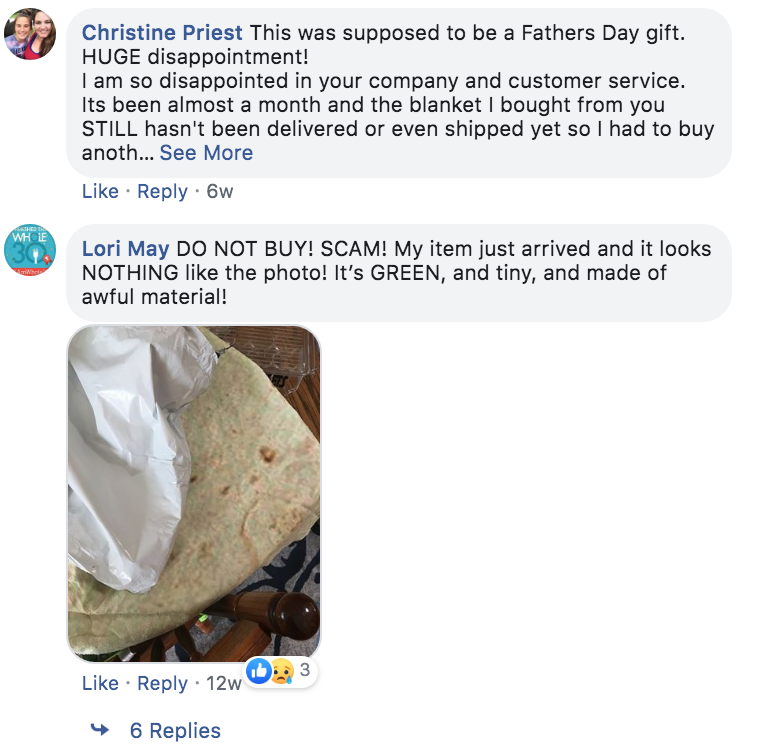
Bingo!
No dropshipper wants to see comments like these from customers. The store failed on every level – no support, slow delivery times and a poor quality product to top it all off.
Low Exchange Price
That Explains The Low Exchange Price. It’s a shame because the store would have had so much potential if they spent more time selecting a good supplier first. They ran before they could walk and sent too much traffic to the product without verifying the supplier. Let’s look at the numbers from the Exchange listing to examine the stores first 2 months in more detail.
Estimating Sales
What Could have Been
The Sales Data
280,000 Website Visits
1.7% visitors convert to sales
5,000 Sales
Store Revenue of $176,904
Blanket Selling Price $29.95
Purchase Price Of $15.00
Cost of Goods $75,000
Gross Profit of $101,904
$60,000 Net Profit
$42,000 On Ads
Store Benchmarks
$8.4 cost per lead
$0.15 cost per click
All the data above is before the refund and chargeback requests not disclosed. If the owner of the store put more effort into finding a quality supplier there is no doubt that this store would have continued to make $30,000 profit per month, however, it failed before it even started. The store’s reputation is now forever tainted by poor customer reviews.
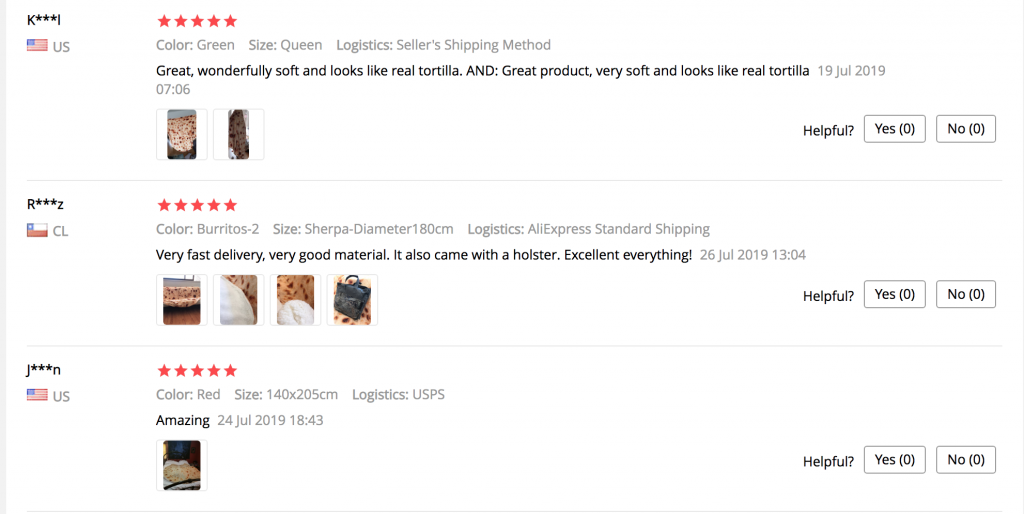
Backup Suppliers
Always Have Backup Suppliers! We found multiple good suppliers on AliExpress with positive feedback for this exact product. It just takes time to review each of them and get the information that matters.
Gone by June
How The Store Died In June. Due to the poor customer feedback and lack of updates, the payment account for the store was likely shutdown when customers started to initiate chargebacks (it’s why there’s a loss in June). The advertising account was also likely shutdown due to poor customer experience on Facebook when customers started to complain of a poor product, no product showing up, slow delivery times (3mo+ in some cases) and no support.
In summary, the downfall of this million dollar store was the supplier. Don’t let that ever be your problem. With the right preparation you can easily avoid the same situation.
Put your new knowledge to use and tap 'Add to Chrome' on the Web Store.